Coranavirus Map - Tableau
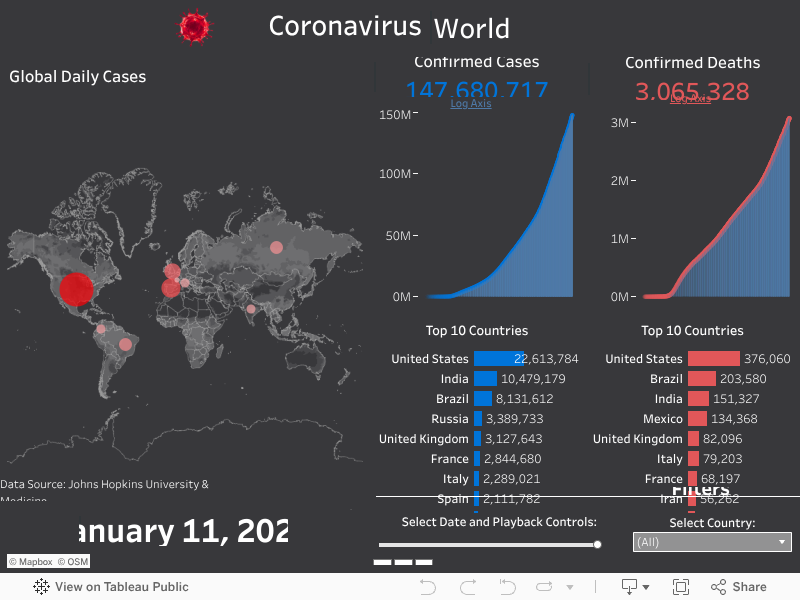
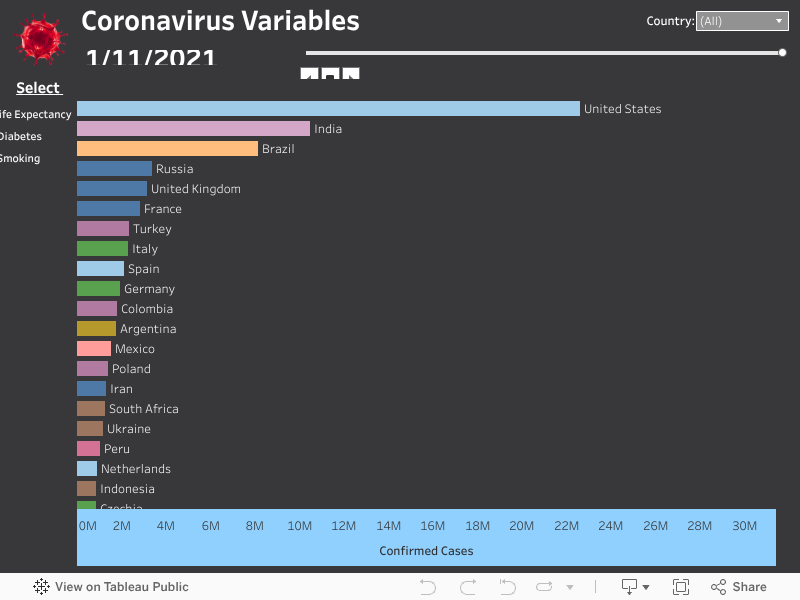
This project uses Tableau to visualise the Coronavirus data provided by the Johns Hopkins University of Medicine. The dashboard uses the basic information of confirmed cases and deaths. The second plots illustrate the relationship between different variables and death per case ratio of a country. The visualisations allow for Playback using the right/left arrows, the dropdown menu to filter the Country and the slider for the Date.